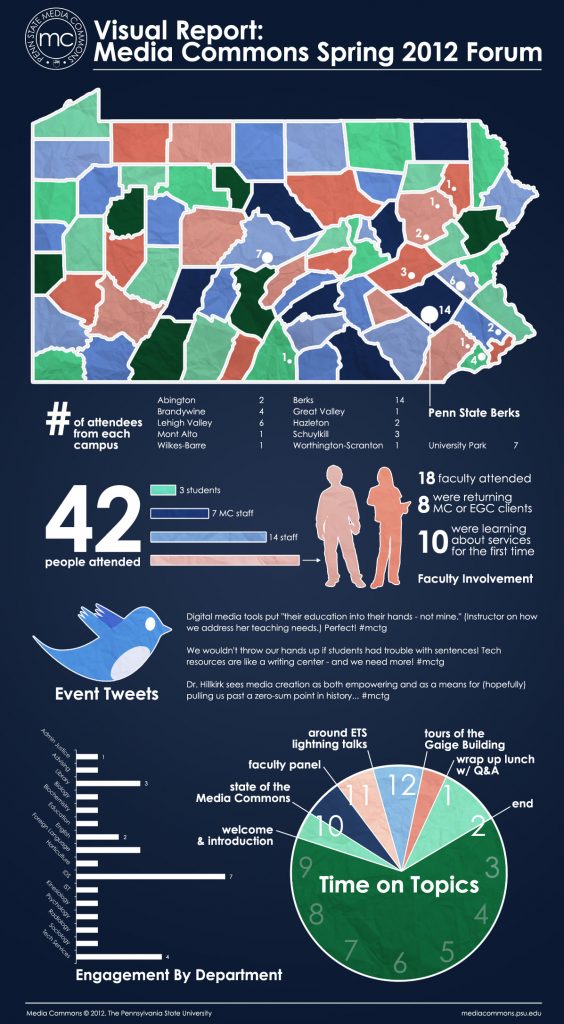
Media Commons creates a lot of reports on our services, our training, our support and our events. Many of these reports contain data that is particularly informative but not always the easiest to present to the public as it’s often relatively specific to our staff. We have been thinking for some time that it would be great to come up with a more engaging way of sharing our statistics and outcomes and recently used the Spring 2012 Forum at Penn State Berks as an opportunity to mock up an infographic of the day’s happenings: